The Oakville community of Ford is an upscale area of Town located in the southeast section of the Oakville. Housing options in Ford include primarily upscale detached homes, with a limited number of other options.
The Ford real estate market experienced a few more ups and downs throughout the first half of 2015 than other communities in Oakville. Here are some key statistics for the Ford Real Estate market for the first six months of 2015.
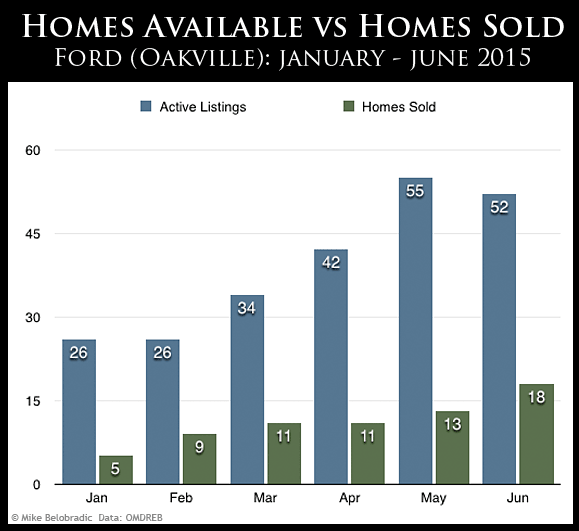
Ford Homes Available versus Homes Sold
When looking at Active Listings and Homes Sold in the chart above, it is clear that the number of homes sold increased each month through the first half of the year. In addition to this, there is one key statistic that REALTORS® use as an indicator for what is happening within the real estate market. This is known as "Absorption Rate" or "Months of Inventory." (Some people show Absorption Rate as a percentage, but I find that to be more confusing than Months of Inventory.)
Ford Real Estate Market: Months of Inventory for 2015
Months of Inventory Defined
In simple terms, Months of Inventory (number of active listings divided by number of homes sold) tells us how quickly the overall inventory of homes is selling. The lower the number of months, the faster that homes would "sell out" if no new homes came on the market.
Months of Inventory (MOI) is an important real estate formula because it can help us to understand the market and how to position a home for sale within that marketplace. For example, we know that in an environment of low MOI (anything below four months), sales are moving quickly so it may be an opportunity to price your home more aggressively (but not at an unreasonable level--we still want it to sell). On the other hand, when MOI numbers are higher (above 6 months), anyone who needs to sell a home quickly would be wise to price their property more favorable, in line with the lower end of recent home sale prices in order to increase the likelihood of a faster sale in a Buyer's Market.
Anything under 4 Months = Seller’s Market
From 4 - 6 Months = Balanced Market
Anything over 6 Months = Buyer’s Market
Ford Real Estate - Months of Inventory Numbers, Mid-Year 2015
- January: 5.2 months (Balanced Market)
- February: 2.9 months (Seller’s Market)
- March: 3.1 months (Seller’s Market)
- April: 3.8 months (Seller’s Market)
- May: 4.2 months (Balanced Market)
- June: 2.9 months (Seller’s Market)
Ford moved back and forth between a Balanced Market and a Seller's Market over the course of the first half of 2015. This is not unusual, considering the relatively higher price of homes in this area (see chart below).
How Quickly Were Homes Selling in Ford?
Days on Market (DOM) is a measure of how long it took, on average, for a home to sell. Generally speaking, if a home sells in less than 30 days, that is a respectable figure.
For the first four months of the year, homes in Ford were actually selling at a faster rate than the Town of Oakville on average. Towards the end of the first half of the year, the pace slowed slightly, putting the Ford average marginally higher than the Town average (see above). So while the Months of Inventory of homes in Ford was higher relative to other parts of Oakville, homes that did sell were doing so faster than the Town average for most of the first half of the year.
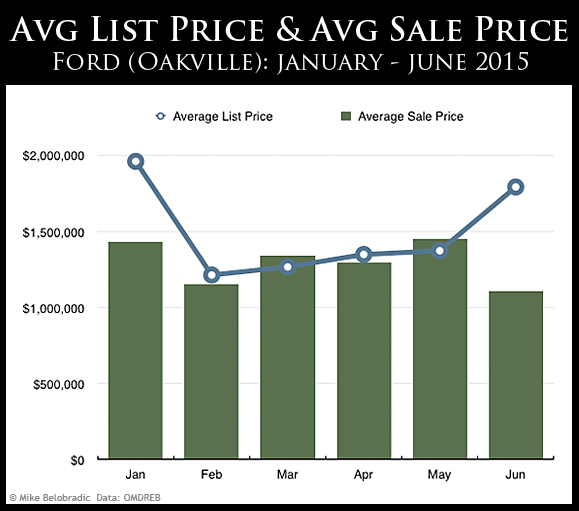
Average List Price and Average Sale Price of Ford Homes
The chart above illustrates the up and down ride that Ford real estate experienced in the first half of 2015. At times there was a wide gap between list price and sale price, while at other points the sale price surpassed the asking price, on average. Overall, however, the market in Ford was quite healthy in the first half of 2015.
Here are the raw figures for average list price and average sale price for Ford homes in 2015.
All Homes in Ford
Month - Average List Price - Average Sale Price
- Jan $1,960,533 $1,429,000
- Feb $1,212,700 $1,149,375
- Mar $1,266,021 $1,339,167
- Apr $1,347,872 $1,294,909
- May $1,372,250 $1,451,846
- Jun $1,792,147 $1,104,731
The average sale price of a home in Ford ranged between $1.1-million and $1.4-million for the first six months of 2015. This is among the highest, on average, in the Town of Oakville.
There were a total of 67 homes sold in Ford in the first half of 2015.
The highest sale price for a home in Ford for the first half of 2015 was $2.85-million.


