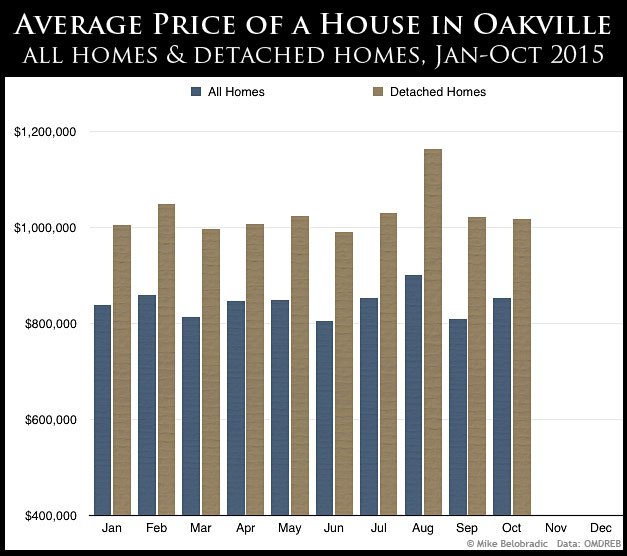
The average price of a house in Oakville rose in October 2015 following a significant drop of nearly $100,000 in September. However, not all sectors of the market saw price increases as detached homes in Oakville fell slightly for the second straight month.
Average Price of a House in Oakville
The average price of a home in Oakville was $847,077 in October 2015, up from $806,103 in September. This represents an increase of 5.1% over the previous month, showing a slight rebound for overall house prices in Oakville in October.
Average Price of a Detached House in Oakville Drops in October
Not all homes increased in price last month. The average price of a detached house in Oakville was $1,014,334 in October, down from $1,021,519 in September. This represents a slight decrease of 0.7% for a detached home in Oakville.
Average Price of a Home in Oakville, Year-to-Date (January to October 2015)
Here is how the average sale price of an Oakville house has changed month-by-month, year-to-date:
- Jan $838,277
- Feb $858,061
- Mar $812,499
- Apr $847,023
- May $849,156
- Jun $804,708
- Jul $851,674
- Aug $900,849
- Sept $806,103
- Oct $847,077
Average Price of a Detached House in Oakville, Year-to-Date (January to October 2015)
Here is how the average sale price of a detached house in Oakville has changed month-by-month, year-to-date:
- Jan $1,005,145
- Feb $1,049,506
- Mar $996,122
- Apr $1,007,301
- May $1,023,919
- Jun $991,362
- Jul $1,030,080
- Aug $1,163,146
- Sept $1,021,519
- Oct $1,014,334
