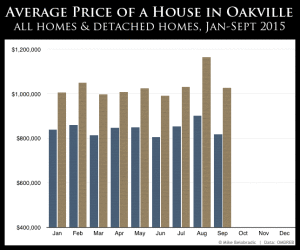
The average price of a house in Oakville fell slightly in September 2015 on the heels of the strongest month of the year for Oakville home prices in August. Prices were down for both detached homes and all homes (which includes all properties, such as townhomes and condominiums).
Average Price of a Detached House in Oakville
The average price of a detached house in Oakville fell to $1,021,519 in September, down from $1,163,146 in August. This represents a decrease of -12% for a detached home in Oakville. While the average price for a detached home in Oakville remained above the $1,000,000 mark in September, the average savings of nearly $140,000 (versus August prices) was welcome news for home buyers in the Oakville market last month.
Average Price of a Home in Oakville
The average price for all homes in Oakville was $808,044 in September, down from $900,849 in August. This represents a slightly more modest decrease of -10.3% over the August average and was among the lowest months of the year so far. This was still good news for home buyers, as only the months of March and June had a lower average house price than September.
The average price of a house in Oakville fell slightly in September.
Oakville Average House Prices Year-to-Date (January to September 2015)
Here is the average selling prices of a home in Oakville on a month-by-month basis, year-to-date:
- Jan $838,277
- Feb $858,061
- Mar $812,499
- Apr $847,023
- May $849,156
- Jun $804,708
- Jul $851,674
- Aug $900,849
- Sept $808,044
Oakville Detached Homes Average House Prices Year-to-Date (January to September 2015)
Here are the average selling prices of a detached home in Oakville on a month-by-month basis, year-to-date:
- Jan $1,005,145
- Feb $1,049,506
- Mar $996,122
- Apr $1,007,301
- May $1,023,919
- Jun $991,362
- Jul $1,030,080
- Aug $1,163,146
- Sept $1,021,519
Note: All data is from the Oakville, Milton & District Real Estate Board (OMDREB) and does not include any listings not appearing on this board. Data is accurate as at 15 October 2015, but minor variations in the most recent quoted prices can occur as some transactions for September may not yet have closed.
